1
Kennzahlen beschreiben
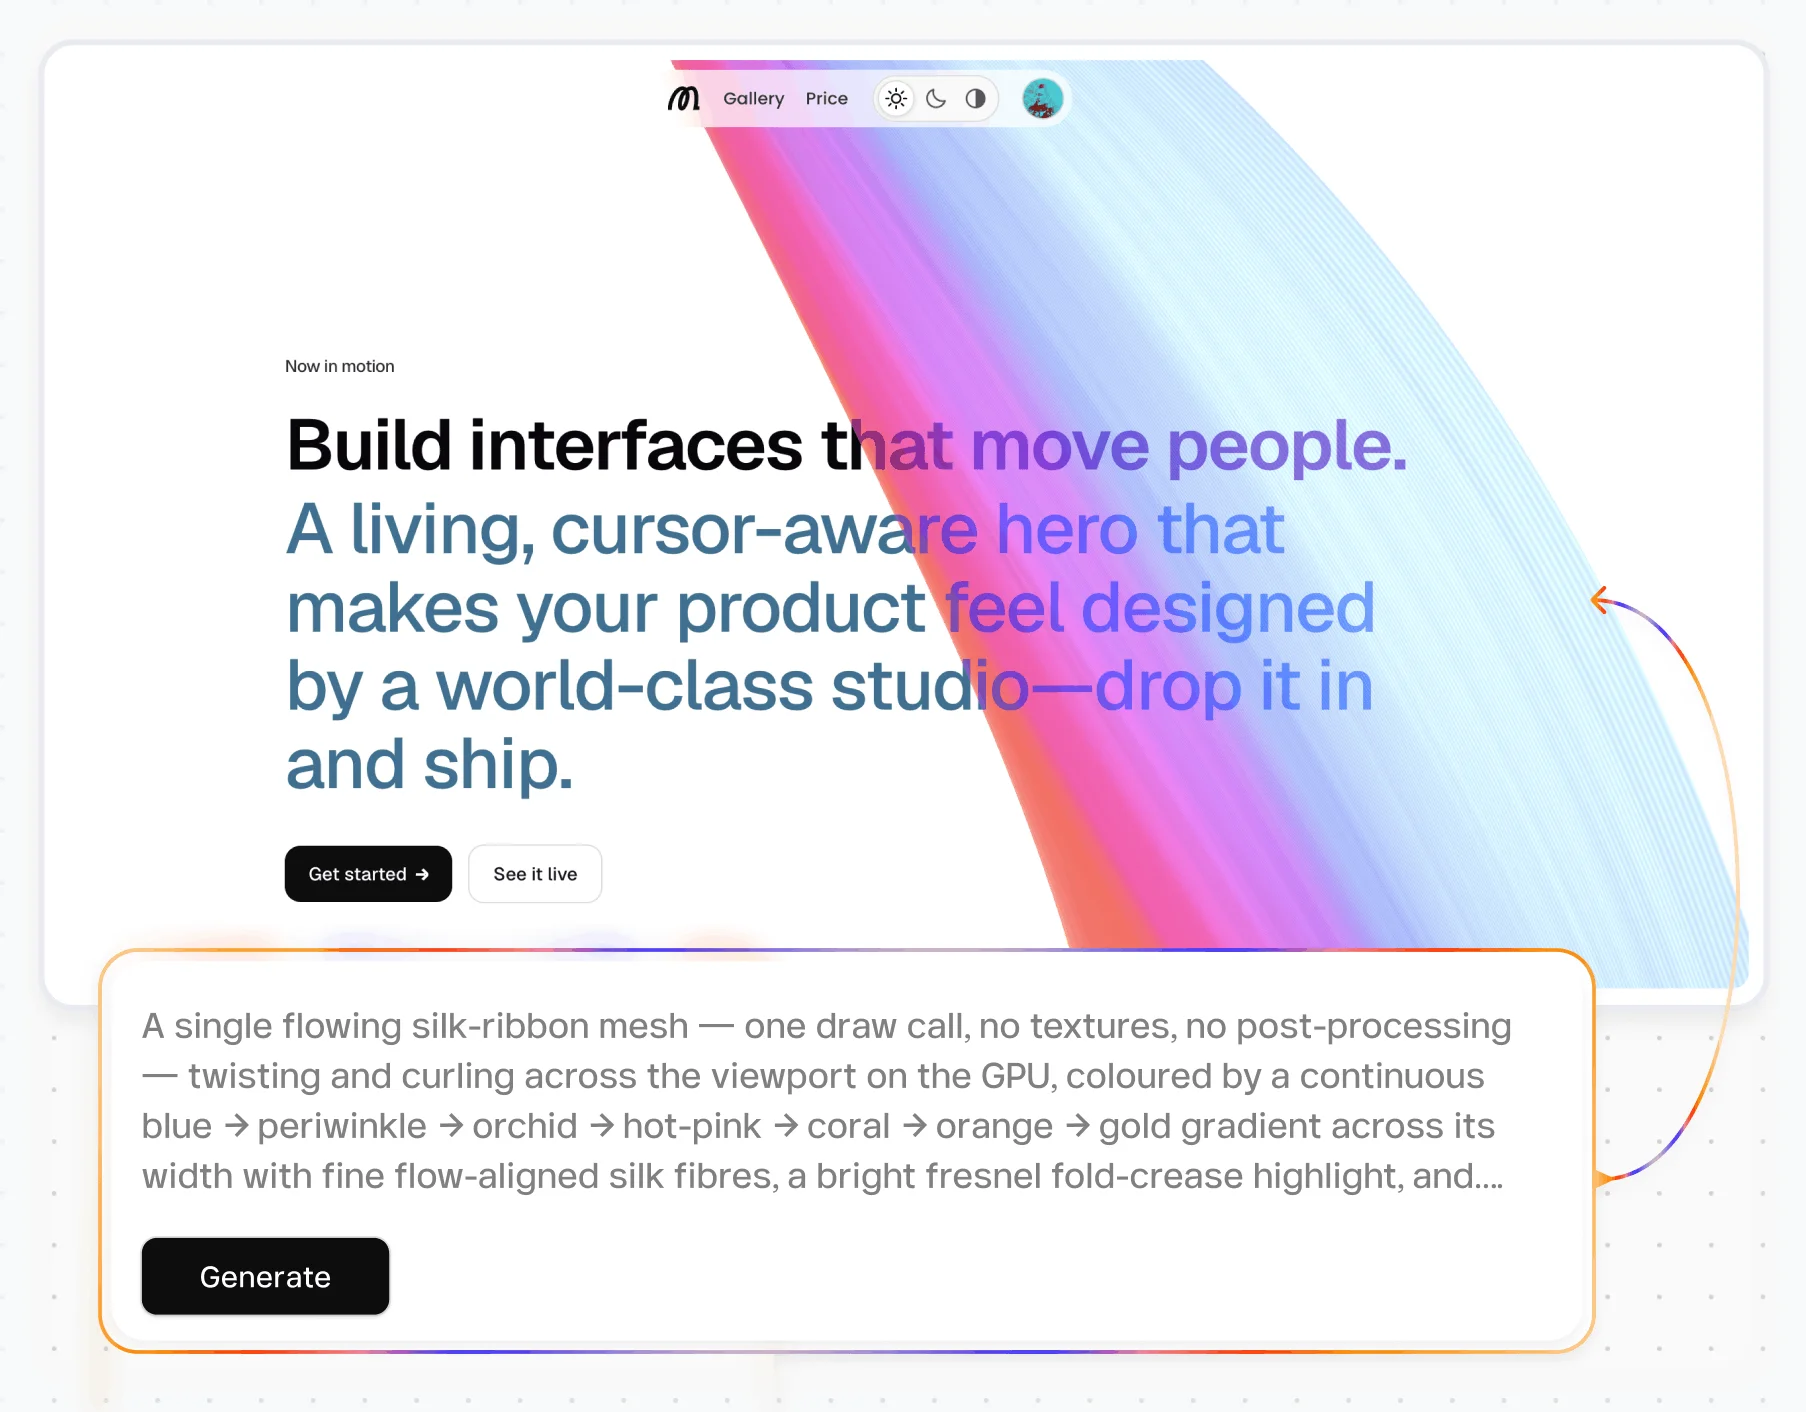
Sagen Sie Modulify, was Sie verfolgen: OEE, Ausbringung, Stillstand und Fehlerquote.

Verfolgen Sie OEE, Ausbringung und Stillstände in einer Ansicht, damit Ihre Linie ihr Bestes leistet.
Kennzahlen beschreiben
Sagen Sie Modulify, was Sie verfolgen: OEE, Ausbringung, Stillstand und Fehlerquote.
Dashboard generieren
Modulify erstellt Kennzahlen, Liniendiagramme und Filter, zugeschnitten auf Ihre Produktion.
Daten verbinden
Verbinden Sie Produktions- oder Maschinendaten, damit Ausbringung und Stillstandszeiten automatisch aktualisiert werden.
Branden und veröffentlichen
Wenden Sie Ihr Markendesign an, verbinden Sie Ihre Domain und teilen Sie das Live-Dashboard mit Ihrem Team.
Ein Fertigungs-Dashboard zeigt OEE, Ausbringung, Stillstände und Ausschussquote über Linien und Maschinen hinweg an einem Ort. Modulify macht aus einer kurzen Beschreibung ein Live-Dashboard mit den wichtigsten Kennzahlen oben, Diagrammen nach Linie und Schicht sowie Filtern, damit Sie den Durchsatz steigern und Ausschuss senken. In wenigen Minuten einsatzbereit.
On the floor, a slow line or a quality dip costs money every hour it goes unseen. You need OEE, output, and downtime in one view, split by line, machine, and shift, so you can act before the numbers slip. Modulify builds that dashboard from a prompt and keeps every metric editable.
A strong production dashboard leads with efficiency and quality, not raw counts. It puts OEE, output, downtime, and defect rate up top, then breaks them down by line, machine, and shift so you can find the bottleneck. Modulify structures your dashboard that way and lets you add metrics and segments as your operation grows.
From a single cell to a full plant, you get one view that turns floor data into higher throughput and less waste.
Von der Landingpage bis zur kompletten Content-Website, dank KI schneller live.
Häufige Fragen zum Bauen von Fertigungs- und Produktions-Dashboards mit Modulify.
Lead with OEE, output, downtime, and defect rate, then add breakdowns by line, machine, and shift. Modulify puts efficiency and quality up top so you can see throughput at a glance, then drill into the line or shift where performance drops.
Ja. Filtern Sie nach Linie, Maschine oder Schicht, um Ausbringung und Qualität zu vergleichen. Modulify baut diese Auswertungen direkt ins Dashboard ein, sodass Sie den Engpass genau bestimmen und dort ansetzen, wo der Durchsatz am stärksten steigt.
Ja. Stillstandszeit und Fehlerquote stehen mit Trendverläufen ganz oben, sodass Verluste sofort sichtbar sind. Sobald die Produktionsdaten angebunden sind, hält Modulify diese Werte laufend aktuell und hilft Ihnen, ungeplante Stopps zu verringern und Qualitätsprobleme zu erkennen, bevor sie größer werden.
Yes. Connect your production or machine data and the dashboard populates with OEE, output, and downtime. Modulify keeps everything in sync, so the view reflects the floor now instead of a manual shift report.
No. Describe the production metrics you track and Modulify generates the dashboard, charts, and filters. You edit anything with plain language, so plant and operations teams can launch it without engineering support.
Was Teams sonst noch mit Modulify bauen.
Dashboards für Werbekampagnen
Sehen Sie Ausgaben, ROAS und Conversions aller Kampagnen in einer Ansicht, die Ihr Team sofort versteht.
KI-gestütztes Business-Insights-Dashboard
Bündeln Sie Umsatz, Wachstum und Betrieb in einer KI-gestützten Ansicht, die Ihre Führung täglich nutzt.
Kundensupport-Dashboards
Verfolgen Sie Tickets, Reaktionszeit und CSAT in einer Ansicht, damit der Support nie hinterherhinkt.