
1
KPIs beschreiben
Listen Sie die Umsatz-, Wachstums- und Betriebskennzahlen auf, die die Führung auf einem Bildschirm braucht.

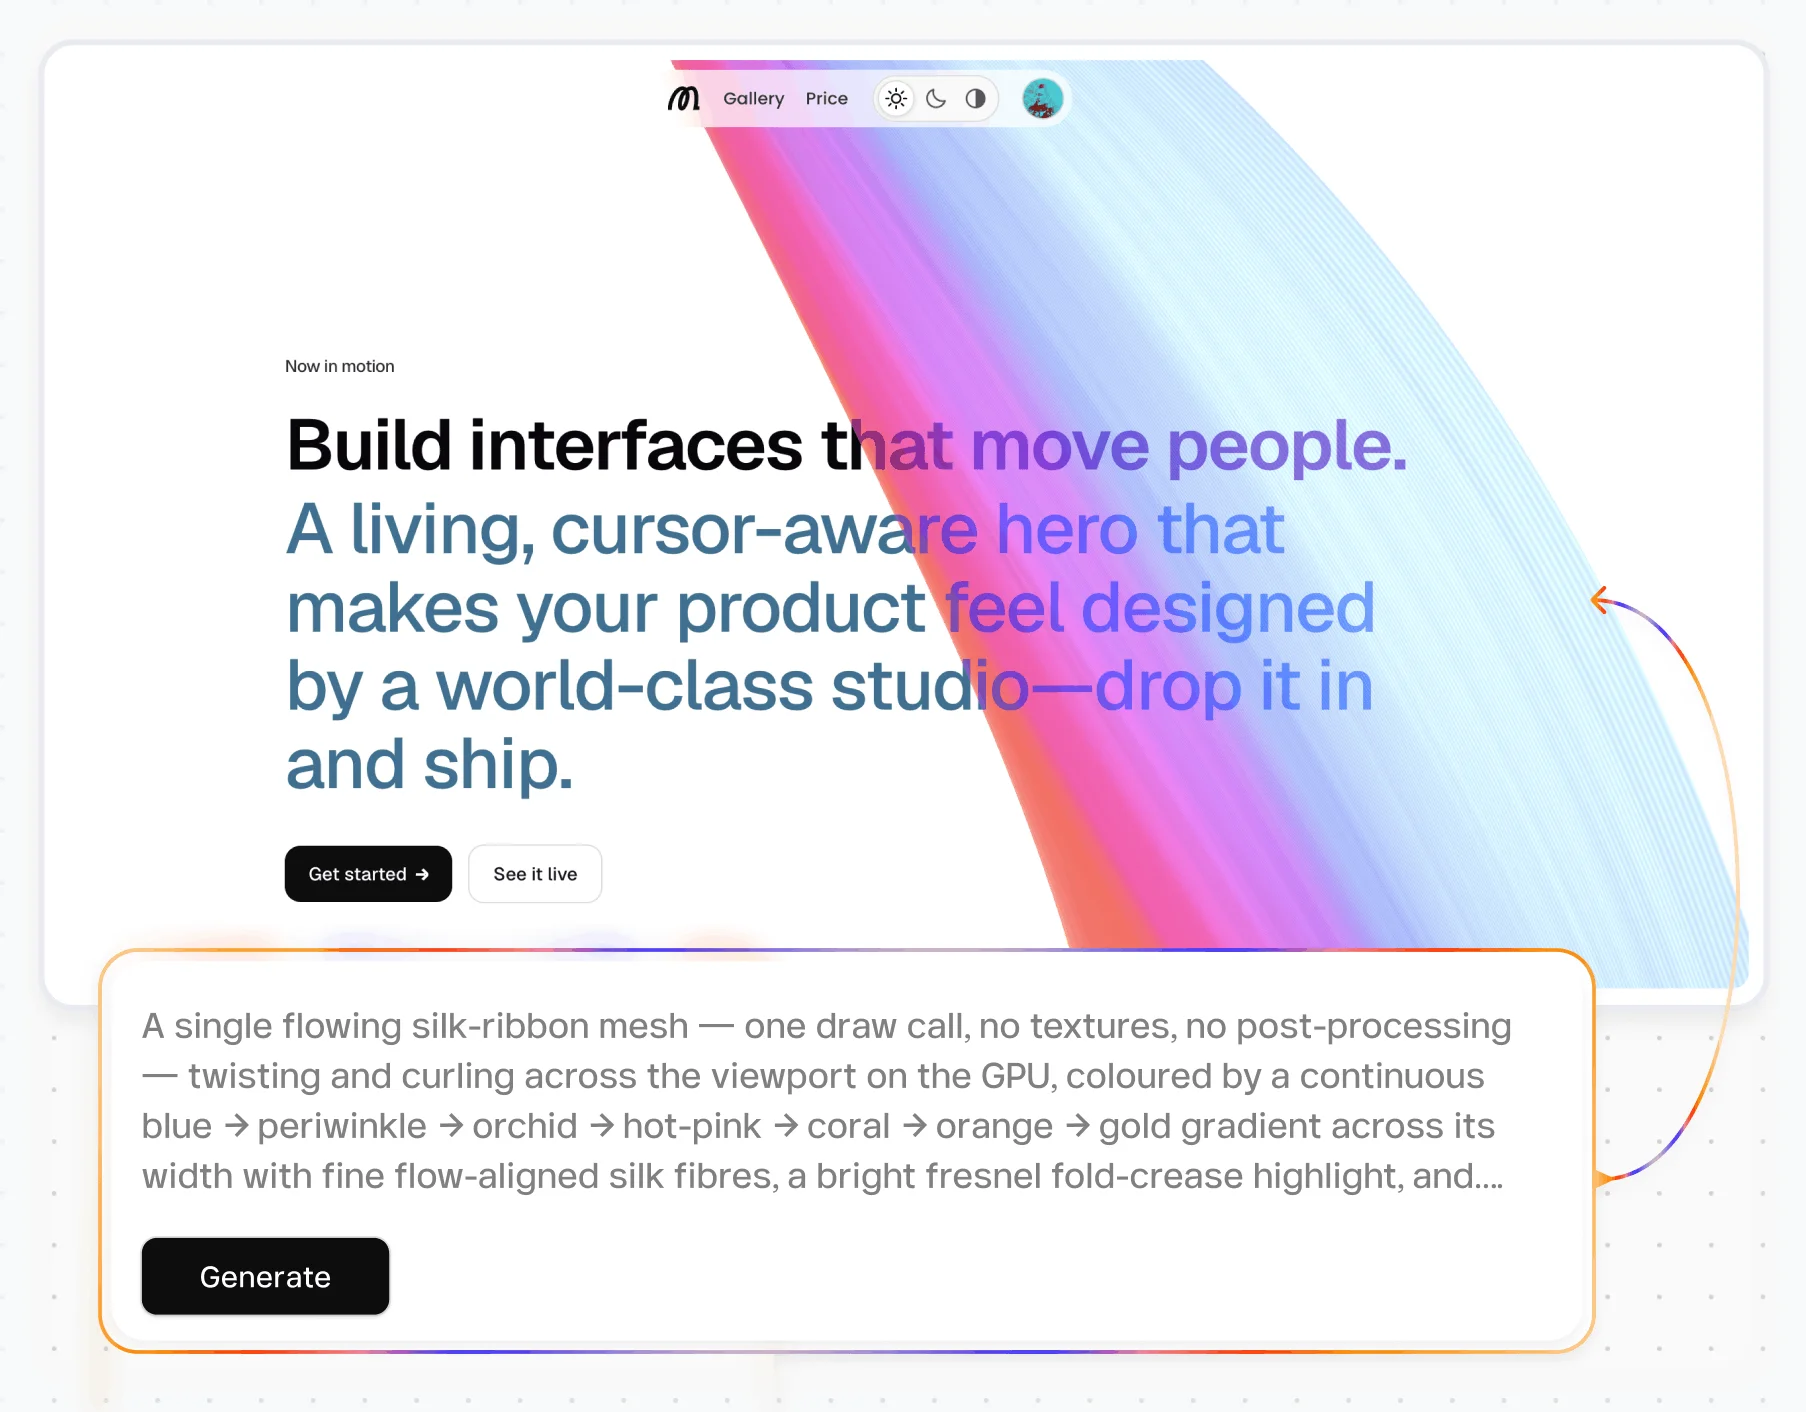
Bündeln Sie Umsatz, Wachstum und Betrieb in einer KI-gestützten Ansicht, die Ihre Führung täglich nutzt.
KPIs beschreiben
Listen Sie die Umsatz-, Wachstums- und Betriebskennzahlen auf, die die Führung auf einem Bildschirm braucht.
Dashboard generieren
Modulify erstellt Kernzahlen, Trenddiagramme und Filter über Ihre wichtigsten Geschäftsbereiche.
Quellen verbinden
Verbinden Sie Ihre Daten, damit Umsatz, Wachstum und Betrieb live und synchron bleiben.
Branden und veröffentlichen
Wenden Sie Ihr Branding an, verbinden Sie Ihre Domain und geben Sie der Führung eine bearbeitbare Live-Ansicht.
Ein KI-gestütztes Business-Insights-Dashboard vereint Umsatz, Wachstum und operative Kennzahlen, sodass Führungskräfte das ganze Unternehmen auf einen Blick sehen. Modulify macht aus einer kurzen Beschreibung ein Live-Dashboard mit Top-KPIs, Trenddiagrammen und Filtern, damit Sie erkennen, was sich geändert hat, in Minuten fertig.
Executives do not have time to stitch numbers from five tools. You need revenue, growth, and operations on one screen, with the trend and the reason a number moved. Modulify generates a business insights dashboard from a prompt, surfaces the KPIs that matter, and keeps every metric editable as priorities shift.
A useful insights dashboard leads with the handful of numbers that define the business, like revenue, growth rate, and a core efficiency metric. It shows trends over time, flags outliers, and lets leaders drill into any team or region. Modulify assembles that view from your description and keeps the metrics and layout easy to adjust.
Instead of five disconnected reports, you get one dashboard that turns company data into clear, confident decisions.
Von der Landingpage bis zur kompletten Content-Website, dank KI schneller live.
Häufige Fragen zum Bauen von KI-gestütztes Business-Insights-Dashboard mit Modulify.
Beginnen Sie mit Umsatz, Wachstumsrate und einer zentralen Effizienzkennzahl wie Marge oder Burn, ergänzen Sie dann operative KPIs je Team. Modulify stellt die Zahlen, die Ihr Geschäft ausmachen, nach oben und lässt Sie in jeden Bereich eintauchen, um den Grund hinter einer Bewegung zu finden.
Es führt Daten aus dem gesamten Unternehmen zusammen statt aus einer einzigen Quelle. Modulify bringt Umsatz, Wachstum und Betrieb in eine Ansicht, sodass Führungskräfte nicht länger Zahlen aus fünf Tools zusammenkleben, sondern das ganze Geschäft samt Trend und Ursachen auf einem Bildschirm sehen.
Yes. Filter by team, region, product, or period to explain a change instead of guessing. Modulify builds those segments into the dashboard, so a shift in a headline number can be traced to its source in a couple of clicks.
Modulify generates the dashboard from your description, choosing headline KPIs and trend charts that fit your business. You keep full control to add, remove, or reframe metrics, so the view stays focused on the decisions leadership needs to make.
Usually minutes. Describe your KPIs, let Modulify generate the layout and charts, connect your data, and publish. There is no long build cycle, so leadership gets a live, editable view of the business the same day you start.
Was Teams sonst noch mit Modulify bauen.
Dashboards für Werbekampagnen
Sehen Sie Ausgaben, ROAS und Conversions aller Kampagnen in einer Ansicht, die Ihr Team sofort versteht.
Kundensupport-Dashboards
Verfolgen Sie Tickets, Reaktionszeit und CSAT in einer Ansicht, damit der Support nie hinterherhinkt.
Dashboards zur Datenvisualisierung
Verwandeln Sie Rohtabellen in klare Diagramme, die jeder liest, ganz ohne Datenteam und ohne Code.