1
Describe your KPIs
List the revenue, growth, and operational metrics leadership needs on one screen.

Pull revenue, growth, and operations into one AI-powered view your leaders can act on daily.
Describe your KPIs
List the revenue, growth, and operational metrics leadership needs on one screen.
Generate the dashboard
Modulify builds headline numbers, trend charts, and filters across your key business areas.
Connect your sources
Link your data so revenue, growth, and operations stay live and in sync.
Brand and publish
Apply your brand, connect your domain, and give leaders a live, editable view.
An AI-powered business insights dashboard unifies revenue, growth, and operational metrics so leaders see the whole company at a glance. Modulify turns a short description into a live dashboard with headline KPIs, trend charts, and filters, so you spot what changed and why, and decide faster, ready in minutes.
Executives do not have time to stitch numbers from five tools. You need revenue, growth, and operations on one screen, with the trend and the reason a number moved. Modulify generates a business insights dashboard from a prompt, surfaces the KPIs that matter, and keeps every metric editable as priorities shift.
A useful insights dashboard leads with the handful of numbers that define the business, like revenue, growth rate, and a core efficiency metric. It shows trends over time, flags outliers, and lets leaders drill into any team or region. Modulify assembles that view from your description and keeps the metrics and layout easy to adjust.
Instead of five disconnected reports, you get one dashboard that turns company data into clear, confident decisions.
From landing pages to full content sites, shipped faster with AI.
Common questions about building ai-powered business insights dashboard with Modulify.
Lead with revenue, growth rate, and a core efficiency metric like margin or burn, then add operational KPIs by team. Modulify surfaces the numbers that define your business up top and lets you drill into any function for the reason behind a move.
It unifies data from across the company instead of one source. Modulify pulls revenue, growth, and operations into one view so leaders stop stitching numbers from five tools and see the whole business, with the trend and the why, on a single screen.
Yes. Filter by team, region, product, or period to explain a change instead of guessing. Modulify builds those segments into the dashboard, so a shift in a headline number can be traced to its source in a couple of clicks.
Modulify generates the dashboard from your description, choosing headline KPIs and trend charts that fit your business. You keep full control to add, remove, or reframe metrics, so the view stays focused on the decisions leadership needs to make.
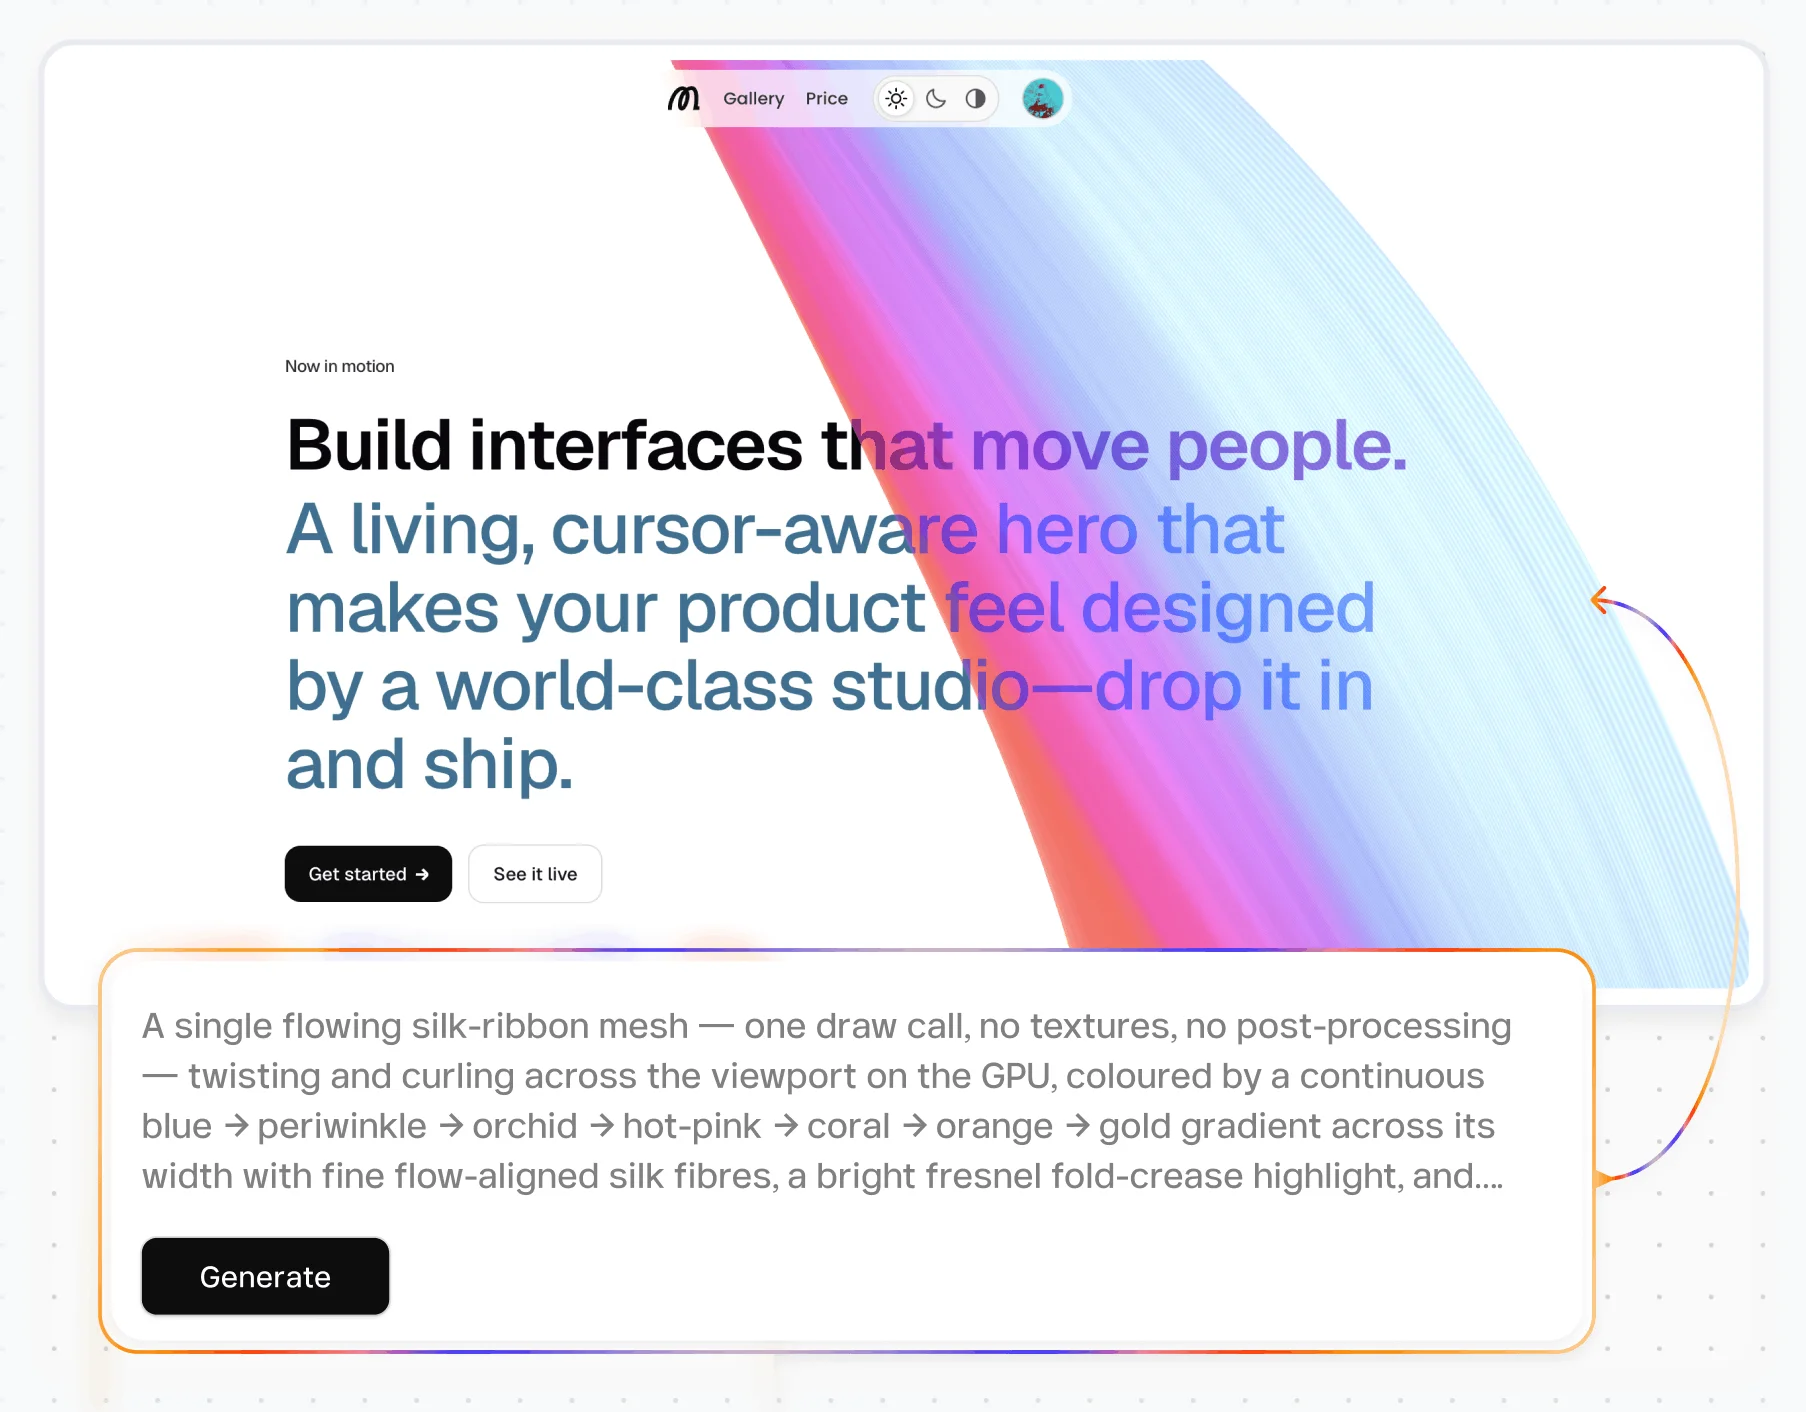
Usually minutes. Describe your KPIs, let Modulify generate the layout and charts, connect your data, and publish. There is no long build cycle, so leadership gets a live, editable view of the business the same day you start.
Other things teams build with Modulify.
Ad Campaign Dashboards
See spend, ROAS, and conversions across every campaign in one view your team can read fast.
Customer Support Dashboards
Track tickets, response time, and CSAT in one view so support never falls behind.
Data Visualization Dashboards
Turn raw tables into clear charts anyone can read, without a data team or code.